
Primary Model Predicts Trump Re-election
Helmut Norpoth
Stony Brook University
The Primary Model gives President Donald Trump a 91%-chance of winning re-election in a matchup against Democrat Joe Biden (http://primarymodel.com/). Trump is predicted to get 362 electoral votes, Biden 176.[1] To be sure, the forecast of a near-certain Trump victory strains credulity. Polls have shown Trump trailing Biden in the ReaClearPolitics average every day of this election year thus far. This, of course, feels eerily familiar. In 2016, polls and poll-aggregation forecasts projected a sheer-insurmountable lead for Hillary Clinton: Trump simply had no path to the presidency. In contrast, the Primary Model gave Trump an 87%-chance of winning although that was based on a popular-vote forecast that turned out to be wrong (Norpoth 2016).
To avoid such confusion, the Primary Model simply predicts the electoral vote this time. It does so not by extrapolating it from a popular-vote forecast but by making it straight from the model predictors. In the event that one candidate wins the popular vote and the other the electoral vote, as happened in 2016, all that matters is the electoral vote. For the record, the Primary Model gets the electoral-vote winner right in 25 of the 27 elections from 1912 to 2016.
Table 1. The Record of the White House Party in Presidential Elections since 1960 (Electoral Vote)

Aside from primaries, the Primary Model takes advantage of a dynamic in presidential elections that can be tracked for almost two hundred years, ever since the formation of a two-party system (Norpoth 2014). As an illustration consider the pattern displayed in Table 1 for elections since 1960. Whenever a party had held the White House for one term, it went on to win (W) six of seven elections; whenever it held it for two or more terms, it ended up losing (L) seven of eight. All by itself, this pattern makes a first-term president like Trump the odds-on favorite to win in 2020 while also making Hillary Clinton’s loss in 2016, after two Democratic terms, look like no aberration. This conveys a strong sign that American presidential elections obey the swing of an electoral pendulum, at least since 1960.
Figure 1. Democratic Electoral Votes, 1828-2016 (Normalized on 538).

Figure 1 tracks presidential elections for a longer time frame, from 1828 to 2016. Note that the electoral vote is being used, specifically the Democratic number of electors, normalized on 538, the current total. One can spot roughly ten cycles with the naked eye, which translates into a cycle length of about 20 years. In other words, from 1828 to 2016, a party held the White House for about ten years, on the average, that is, between two and three terms. To capitalize on this swing of the electoral pendulum for forecasting, I borrowed an algorithm invented by the British statistician Yule in the 1920’s to gauge cycles in sunspots (Yule 1971). It is worth noting that the sunspot series over two centuries bears an eerie resemblance to the electoral series; electoral analysis, after all, has more in common with astronomy than astrology.
Yule’s algorithm, which boils down to a second-order autoregressive process, yields the following coefficients for the electoral-vote series (1828-2016):
DEMEVt = 253 +0.464 DEMEVt-1 -0 .283 DEMEVt-2
(22) (0.150) (0.129)
It is a simple step from this equation to a 2020 forecast since we know DEMEVt-1 and DEMEVt-2, the Democratic electoral votes in 2016 and 2012. It comes to 221 electoral votes for the Democratic candidate (Biden), and 317 for the Republican (Trump). It may seem farfetched that the results of past presidential elections can predict the future without any other information, be it the identity of the candidates, the record of incumbent administration or else. But that is what two-hundred years of electoral swings can deliver. To be sure, the chances are modest that this kind of prediction will come true. For 2020, it gives Trump a 66% chance of winning. Better than a flip of the coin, but not quite good enough to bet the house. The addition of which predictor would warrant such confidence?
Any review of election forecasting (Norpoth 2018) shows that the economy is by far the favorite predictor followed by presidential approval and polls of vote intentions. Primaries are not, if they make the cut at all. Yet primaries expose candidates to a real-life election, with all the bells and whistles of a campaign. Winning or losing primaries tells us something about how voters size up candidates. Those evaluations have long been proven pivotal for voters’ choices in November (Lewis-Beck at al. 2008). Furthermore, primary performance of incumbents turns out to correlate very strongly with their mid-year approval rating (.76).
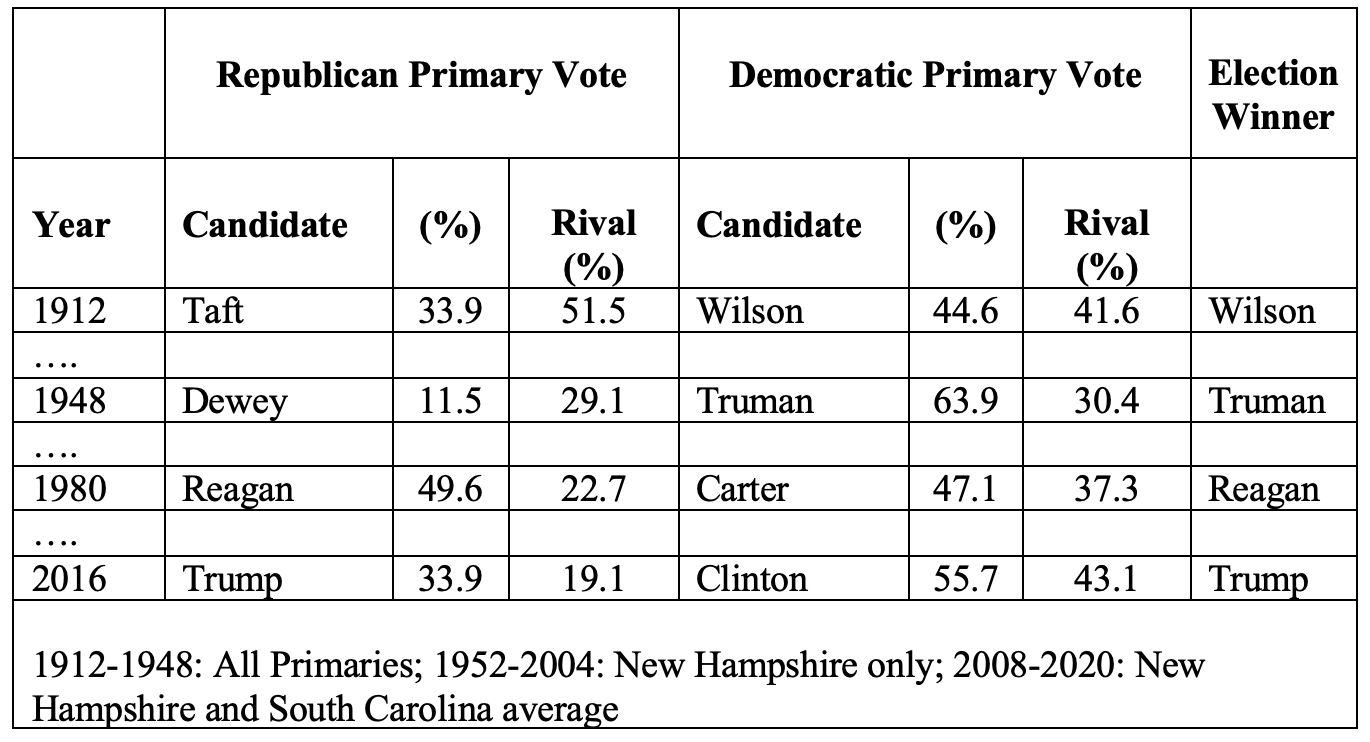
Table 2. The Primary Vote for Presidential Candidates and their Strongest Rivals in Selected Elections
No sooner had primaries been introduced than a former president took advantage of this invention to challenge a sitting president of his own party, which happened in 1912. Theodore Roosevelt wound up soundly defeating incumbent William Howard Taft in the Republican primaries. Even so, the GOP chose to stick with Taft and handed him the nomination for another term at its national convention. Meanwhile, on the Democratic side, Woodrow Wilson, a former professor in our profession, won the primary battle in that party, which then nominated him for president at its national convention. We all know what happened in November of 1912: Wilson was elected president. Putting it all together, one can spot a pattern: The candidate who won his party’s primary vote goes on to defeat the candidate who lost his in the general election.
It seems nobody noticed at the time or wondered if primaries might make for a handy predictor of the vote in November. More than a hundred years on we have a record that can tell if 1912 was just an anecdote. Table 2 assembles a representative sample of presidential elections since primaries were introduced. The list includes 1948, which polls and pundits got wrong. The primaries that year, on the other hand, firmly point to Truman as the winner, with Dewey joining Taft in the hall of primary-general election losers. In 1980, both candidates were primary winners, but Reagan by a far larger margin than Carter, who ended up losing in November. Turning to the most recent election, it is true that Hillary Clinton amassed a larger share of the Democratic primary vote in 2016 than did Trump on the Republican side. But given the varied number of viable contenders—just two vs. a dozen —it is necessary to adapt the metric of primary performance. For contests without a sitting president, that metric uses the relative strength of the nominee compared to the strongest rival.
Not all primaries are equal, of course, in their ability to influence presidential elections. Privilege goes with being first to let voters choose presidential candidates in a primary election. New Hampshire began offering that opportunity in 1952, while also making it extremely easy for candidates to get on the primary ballot: no more than a $1,000 filing fee. No serious contender can afford to skip this state. As for voters, the New Hampshire Primary is not closed to partisans but allows Independents to participate; they generally make up close to half of the electorate on Primary Day. Candidates hoping to win the primary here must appeal to a broader segment than the base. The New Hampshire Primary puts would-be nominees for president to a test like no other state. For all these reasons, the measure of primary performance switched from all primaries to just New Hampshire in 1952.

Table 3. Predicting the Democratic Electoral Vote (1912-2016)
Still, this state’s primary it is not a perfect test. A frequently heard complaint is that New Hampshire is not representative of the nation. In particular, it lacks a demographic critical for success of some Democratic candidates in recent years: African-Americans. South Carolina, a state with an early primary right on the heels of the New Hampshire event in recent years, fills the need for balance. Half of the Democratic electorate in the “First in the South” Primary is black. For the 2016 forecast South Carolina was added to New Hampshire to gauge primary performance and the same was done for the 2020 forecast, at least for the Democratic candidate.[2] The addition of further states does not seem warranted at this time to cover constituencies that might be missing from the mix of New Hampshire and South Carolina.

Table 4. Model Predictions of Democratic Electoral Votes
Joe Biden scored a solid win in South Carolina to rebound from a poor finish in New Hampshire; his average score in those two primaries relative to the strongest rival came to 48%. By comparison, Trump soundly defeated a prominent Republican, former Massachusetts Governor William Weld, in New Hampshire (with 86% of the vote); it is all but certain Trump would have repeated that showing in South Carolina had the Republican primary not been cancelled. Superior primary performance on top of the first-term benefit makes Trump the heavy favorite to win in November. Using the estimates presented in Table 3, the Primary Model predicts 362 electoral votes for Trump, and 176 for Biden, giving the president a 91% chance of winning reelection.[3] Table 4 compares the in-sample predictions with the actual electoral votes for all elections from 1912 to 2016. The offshoot is that the model gets it right in 25 of those 27 elections. One of the two misses is the notorious 2000 election in which, as is widely believed, “the wrong man [was] elected president” (Mebane 2004). Overall, the model’s historical record adds to the confidence in the forecast of a Trump victory in 2020.
References
Lewis-Beck, Michael, William Jacoby, Helmut Norpoth, and Herbert Weisberg. 2008.
The American Voter Revisited. Ann Arbor: The University of Michigan Press.
Mebane, Walter R., Jr. 2004. “The Wrong Man is President! Overvotes in the 2000 Presidential Election in Florida.” Perspectives on Politics 2: 525-535.
Norpoth, Helmut. 2014. "The Electoral Cycle.” PS: Political Science & Politics 47: 332-335.
Norpoth, Helmut. 2016. “Primary Model Predicts Trump Victory,” PS: Political Science and Politics 49 (October 2016). doi:10.1017/S1049096516001323
Norpoth, Helmut. 2018. “Predicting Elections,” in Oxford Handbook of Behavioral Political Science, edited by Alex Mintz and Lesley Terris. New York: Oxford University Press.
Yule, G.U. 1971. “On a method of investigating periodicities in disturbed series with special reference to Wolfer’s sunspot numbers.” In Statistical papers of George Udny Yule, edited by A. Stuart and M. Kendall. New York: Hafner Press, 1971. (Originally published in 1927).
Notes
[1] The 2020 forecast was first posted March 2 (https://twitter.com/primarymodel16). In the event that Bernie Sanders instead of Joe Biden had been the Democratic nominee, Trump’s chance of winning in November would rise to 95%. In that scenario, Trump would get 390 electoral votes, Sanders 148.
[2] It was also done retroactively for the 2008 election. Obama overcame a setback in the New Hampshire Primary with a strong showing in South Carolina.
[3] Following standard practice, Trump’s primary score (85.6%) was capped at 65 and inverted around the mean since the target of the prediction is the Democratic vote. Biden’s primary score was mean-adjusted without inversion. Also, as before, an adjustment was needed for the pre-New Deal period, which was handled by a variable coded 1 for elections prior to 1932, and 0 for elections since then. Yet another adjustment was needed for extreme values of the electoral-vote series from 1968 to 1988, reducing their deviations from the mean by a factor of .8.